Simplifying Data for Unilever’s Marketing Team

Simplifying Data for Unilever’s Marketing Team

AI MARKETING TOOL / WEB APP / DATA VISUALISATION

SHIPPED

CONTEXT

An AI-powered tool to help brand managers track market trends and make data-driven decisions.

I had the opportunity to work with Unilever’s marketing team to streamline their product launch tracking. Creating an early warning system. I was responsible for leading research, conceptualisation, data visualisation and interaction. I Worked closely with the developers to explore and craft intuitive visualisations on PowerBI.

ROLE

Product thinking

User research

Interaction design

Visual design

TEAM

Snigdha

Anshumala - PM

TOOLS

Miro

Figma

XD

PowerBI

TIME

(12 Weeks)

ROLE

Product thinking, User research

Interaction design and Data Visualisation

TEAM

Snigdha
Anshumala - PM

TOOLS

Miro, Figma, XD and PowerBI

TIME

(12 Weeks)

PROBLEM

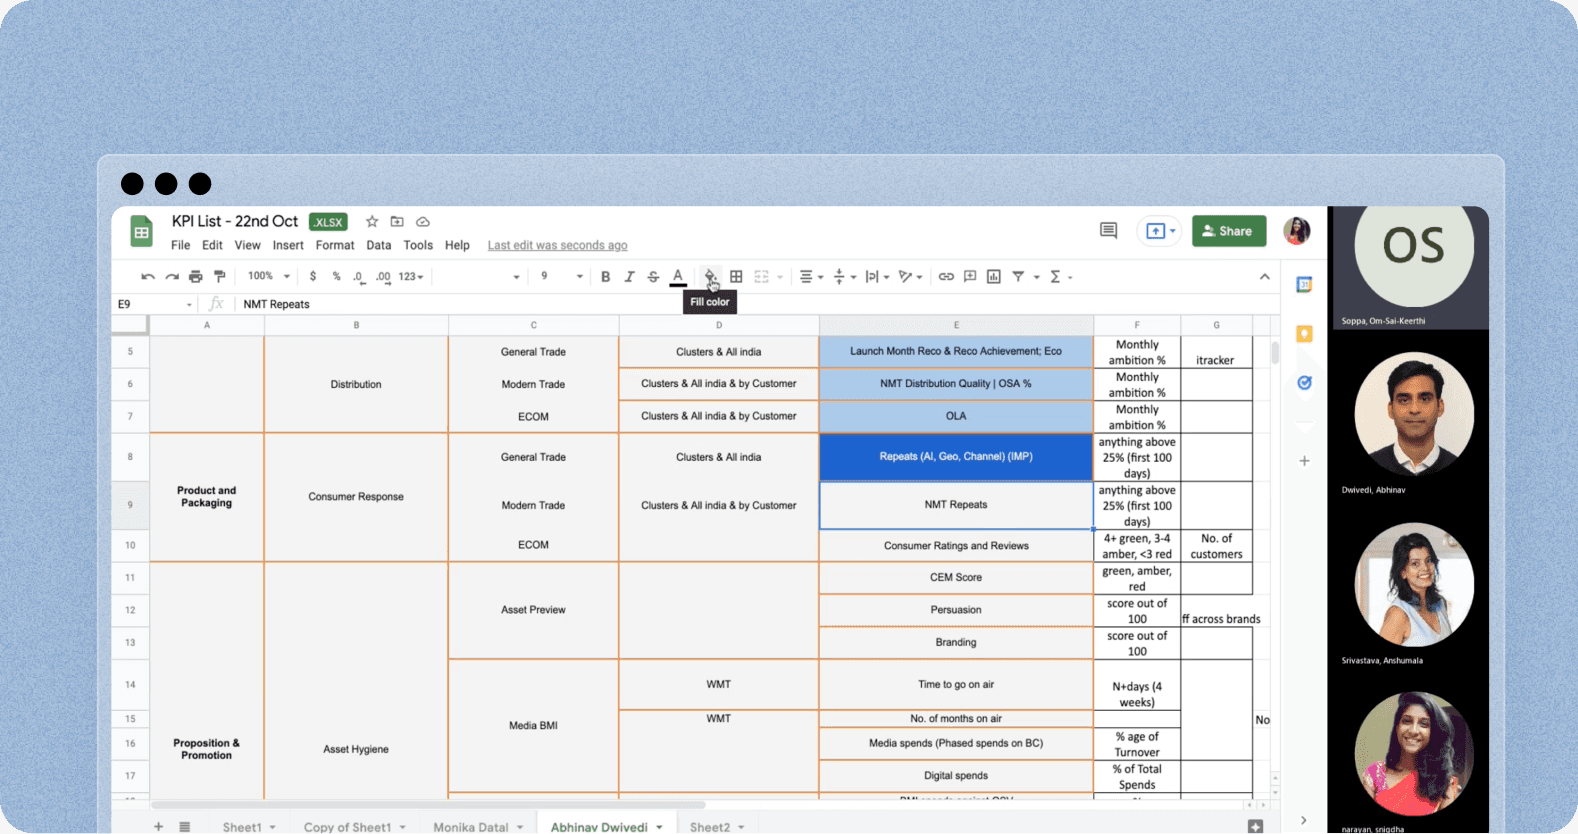
Brand managers struggled to track launches and swiftly identify issues in various stages due to overwhelming data.

Business Goal

Reduce operation inefficiencies & speed up time-to-market

Business Goal

Reduce operation inefficiencies & speed up time-to-market

Business Goal

Reduce operation inefficiencies & speed up time-to-market

Business Goal

Reduce operation inefficiencies & speed up time-to-market

User Goal

Quickly adapt to changes & effectively manage launches

User Goal

Quickly adapt to changes & effectively manage launches

User Goal

Quickly adapt to changes & effectively manage launches

User Goal

Quickly adapt to changes & effectively manage launches

SOLUTION HIGHLIGHTS

Built an overview Dashboard with AI enabled insights

Providing real-time trends & enhanced visibility, making insights easily accessible and digestible

Providing real-time trends & enhanced visibility, making insights easily accessible and digestible

briefcase
briefcase

Making data accessible in under 30s

Making data accessible in under 30s

briefcase
briefcase

Cut decision-making time by 60%

Cut decision-making time by 60%

briefcase
briefcase

Reduced revenue drop by 6% with AI Insights

Reduced revenue drop by 6% with AI Insights

GROUND WORK

Gained context and more..

Conducted two research methods to understand user behavior and pain points.

08

Semi Structured Interviews

My goal was to pinpoint key data points for managers and understand their priorities.

06

Task Observations

I explored how they got things done, what data they relied on, and how they navigated it all.

INSIGHTS

Did you know?

Brand Managers only have 15 min/ day to spare for this task.

Tracking this data isn’t their primary task, it’s just a small part of their day, which I hadn’t realized at first.

They used to spend an hour/day scouting for this scattered
data

Tracking this data isn’t their primary task, it’s just a small part of their day, which I hadn’t realized at first.

They used to spend an hour/day scouting for this scattered data

6/8

Prefer RAG’s

Their excels were full of (Red, amber, green status) Viewed Critical first Information

Their excels were full of (Red, amber, green status) View Critical first Information

8/8

View Data Channel-wise

View Channel data

Channels are basically different trade routes eg. small stores, large retailers, and online.

>5%

Online Resolutions

Focused on turning non-actionable data into predictive insights

DESIGN DECISIONS

DESIGN DECISIONS

Designing a Fast & Scannable Layout

Based on my priority listing from the interview I structured each individual section to cover the essentials of a KPI

Based on my priority listing from the interview I structured each individual section to cover the essential KPI's

The funny traffic light story

The layout was well-received during user testing. On a client call, I shared how I progressed to this version.

Earlier, I’d made a quick mockup during kickoff that looked like traffic lights. Turns out, they liked that version more!

Discovering the Power of Visualizations

After the call, we refined the layout making the visual cues bolder, intuitive & Effortless. Using only the PowerBI Library
which was challenging

After the call, we refined the layout making the visual cues bolder, intuitive & Effortless. Using only the PowerBI Library which was challenging

After multiple iterations and brainstorming sessions with the dev team we landed on these visualisations that made spotting poor performance super easy

IMPACT

Mention the impact here broadly

Learning 01
Something I need to write here to make it look veryyy naaice!!

Learning 02

Something I need to write here to make it look veryyy naaice!!

Learning 03

Something I need to write here to make it look veryyy naaice!!

🍄

Designed with Framer, FOMO & Fatigue

2024 Snigdha Narayan. All Rights Reserved.

Stalk me s’more ->

🍄

Designed with Framer, FOMO & Fatigue

2024 Snigdha Narayan. All Rights Reserved.

Stalk me s’more ->

🍄

Designed with Framer, FOMO & Fatigue

2024 Snigdha Narayan. All Rights Reserved.

Stalk me s’more ->

🍄

Designed with Framer, FOMO & Fatigue

2024 Snigdha Narayan. All Rights Reserved.

Stalk me s’more ->